Summary of State of Web3 Report by Chainalysis
Some numbers go up
Hello there,
I wanted to try a new content format today. Chainalysis released their latest web3 report. The following is a summary of the 109-page report with some commentary from me, as promised in Telegram. You can access the report directly from Chainalysis here. This won’t be going out as an email because I don’t think I should be in your inbox with this.
A quick caveat before you begin - I have used multiple charts to come to/support a conclusion. A different person looking at the same data set may have entirely different conclusions. None of these data points on their own means much. That is why I use four to five charts for each statement made. Each data point is a dot in a larger picture. Let’s go.
Retail is here - Through NFTs and Gaming
The holy grail for adoption in crypto is the average person using it. But technology doesn’t go 0 to 100. In the sense that it does not go from secretive military technology to your mum using it overnight. It seeps through the fabric of society - sticking to niches as it does. Going through the report - it becomes pretty evident. The first chart that caught my attention is the chart below.
The transaction volume across networks started dropping off as early as 2021 Q1 - but the number of transfers has not seen a drop-off. It has only increased up until Q1 this year. One reason for this is that token prices were at an all-time high through Q2 2022 - so when you multiply with a base price, it shows a higher volume. So what. I found it compelling that volume almost dropped off, but transfer's count is within 10% of their all-time high. There are a few reasons for this.
Historically when looking at volume and transfer figures, I used to assume they are bots. But the industry has evolved a bit now. The chart below shows the relationship between the volume received and the number of transfers. ( I find the size of the bubble bit a bit misleading, but let’s ignore that for now).
Two retail-focused services stand out here for me. One is gaming, and the other is NFTs. NFTs seem to have done considerably more in volume ($100bil+) and count of transfers (10mil+) in comparison to gaming which seems to have only ~$8 million or so linked to it in terms of transfer volume. Of course, part of this could be the price rally of NFTs like Bored Apes (valued at $500k+ at peak) compared to in-game assets. My point is - the two sectors seem to have captured the public psyche, and there is enough interest in it now (vs 2019).
But how does that matter? It expands the market. Consider the chart below. It shows the average age of a wallet in each product sector. Dex wallets have more or less flatlined at ~300 days. This assumes the average DeFi user has been active for ~1 year. On average, gaming and NFT wallets were active for less than ~50 days.
The number has gone higher for gaming-linked wallets. I would presume this has to do with play-to-earn models stumbling over the last few months and only old wallets continuing in them. For NFTs - the figure has remained flat. This means an increasing number of newer active wallets have entered the ecosystem. (Or it could mean that users try NFTs and leave right away, keeping the average active wallet’s age low .. )
New wallets don’t mean much. Until they pay fees, and that is where the chart below sheds some light. NFTs were sub 5% of fees paid up until July 2021. Now it is about ~20-25%. I find it quite interesting because of all the categories Chainalysis had data for - NFTs have grown the most. So maybe we should stop hating on them so much..
Long story short - average transaction amounts have trended lower, more transactions are occurring and NFTs are becoming a crucial part of the “onboarding retail” story.
Exchanges have their moment of reckoning.
Decentralised exchanges are at an exciting point in time. The on-chain volume towards them is now equal to what goes towards centralised exchanges. At its peak, DEX-related transactions were ~2.5 times what a CEX saw, but this likely had much to do with yield farming. In the absence of incentives, users may return to centralised exchanges, given their speed and cost-efficiency.
More volume on-chain goes towards decentralised exchanges than it does towards centralised exchanges. Roughly 55% of the volume that goes towards exchanges is now towards decentralised exchanges. I think this number will continue to trend higher with layer two-centric exchanges coming of age in DeFi. Number of reasons for this
DeFi is whale dominated - so the average transaction to a DEX is a far multitude of what the average person using a centralised exchange does
CEXs don’t record transactions on-chain once you deposit capital. The trades on them are not contributing to the on-chain volume.
The data shared by Chainalysis interestingly also observes the brutal power laws in DeFi. For example, the top 5 decentralised exchanges command ~85% of volume. Among their centralised peers, the figure is more so, around 45%. So if you are not in the top 5 for exchanges as a category in DeFi- you are competing for ~15% of the volume.
What about lending? Aave and Compound currently command 90% of the volume sent to lending platforms. The “other” category here is where all the other lending platforms fall and compete in. They get sub 10% of the lending volume that’s left.
One could look at this data and say, ‘dude, DeFi lending is so concentrated”. The market is following typical power-law patterns in the world of the venture is used to. If anything, those platforms are working exceptionally well given the volatility and frequency of liquidations in the past few months. I picked these data sets to show the extent of competition in DeFi among more minor protocols. It is not easy being a DeFi founder, I guess.
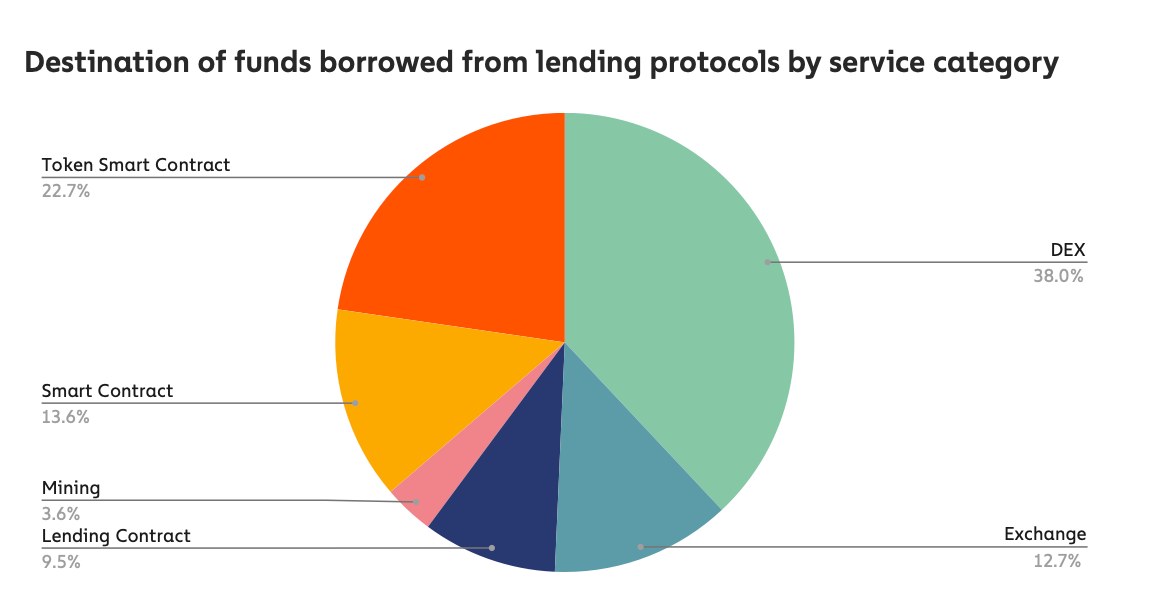
The data interestingly shows what most people use DeFi loans for. Some ~38% of the users sent the asset received in a loan to a DEX. This is typically to trade it for another asset that may rise in value faster than the interest provided for the loan. Essentially, taking a leverage position. Some ~13% of the volume goes to typical exchanges. They could be used as off-ramps, but it is hard to say that. In total - half of all loans taken in DeFi go back to some form of an exchange
What I found interesting is that only 3.6% of the capital taken as loans went to miner-linked wallets. I presume this is likely because leverage among miners comes from more centralised sources like Nexo or banks. So for the moment, it is safe to say DeFi-linked loans are (mostly) used for trading.
DeFi Dominates DAOs
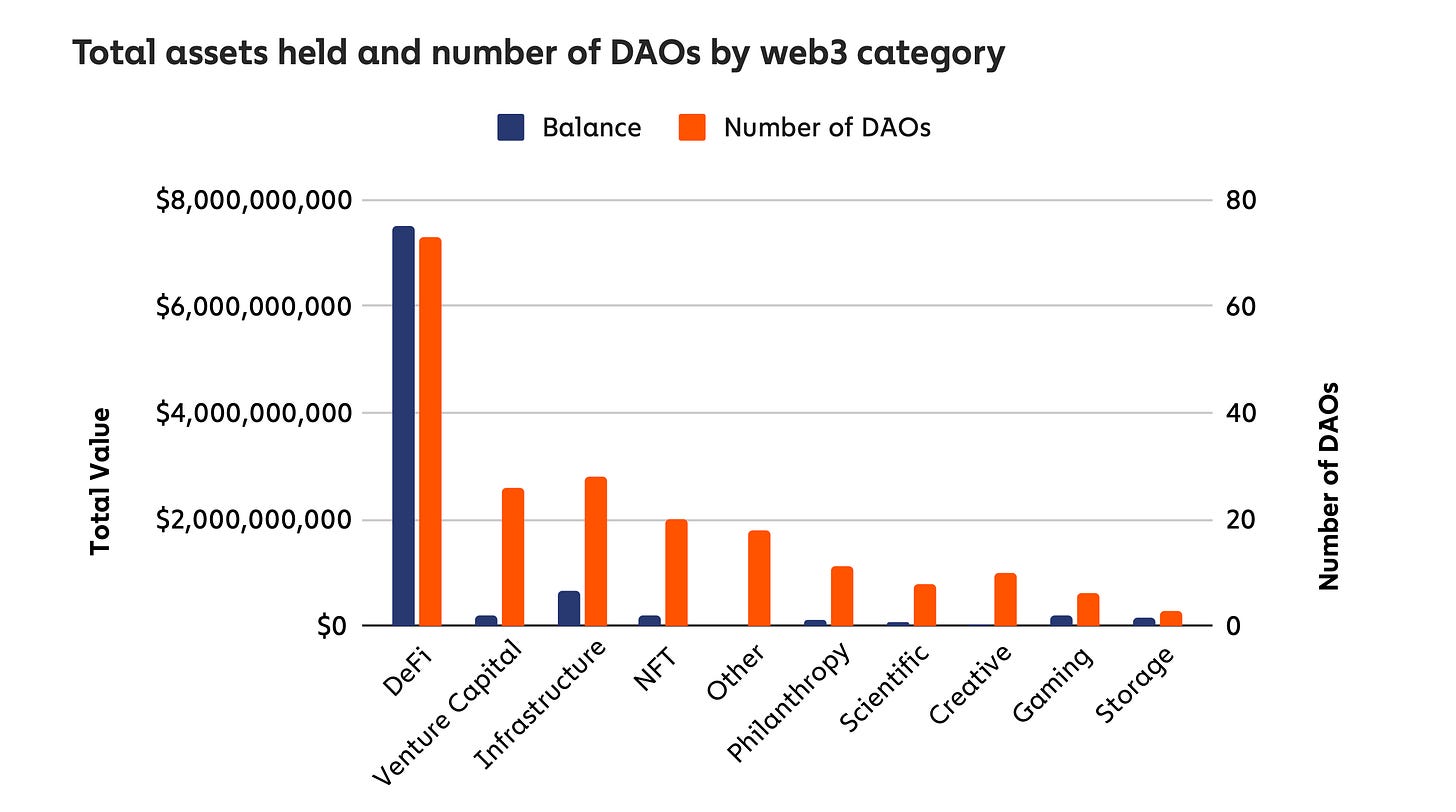
There’s a DAO for practically everything these days. Their efficacy and relevance are still questioned, but it’s becoming clear that DeFi-related DAOs will dominate them for the foreseeable future. DeFi-related ventures hold some 83% of the capital in DAOs. The average DeFi-linked DAO manages ~$100 million. There’s a reason for this. DeFi-related ventures have their cash flows and typical op-ex entirely on-chain. The moment a DAO interacts with the off-chain world, it becomes hard to verify what is going on. (*cough* 3AC *cough*).
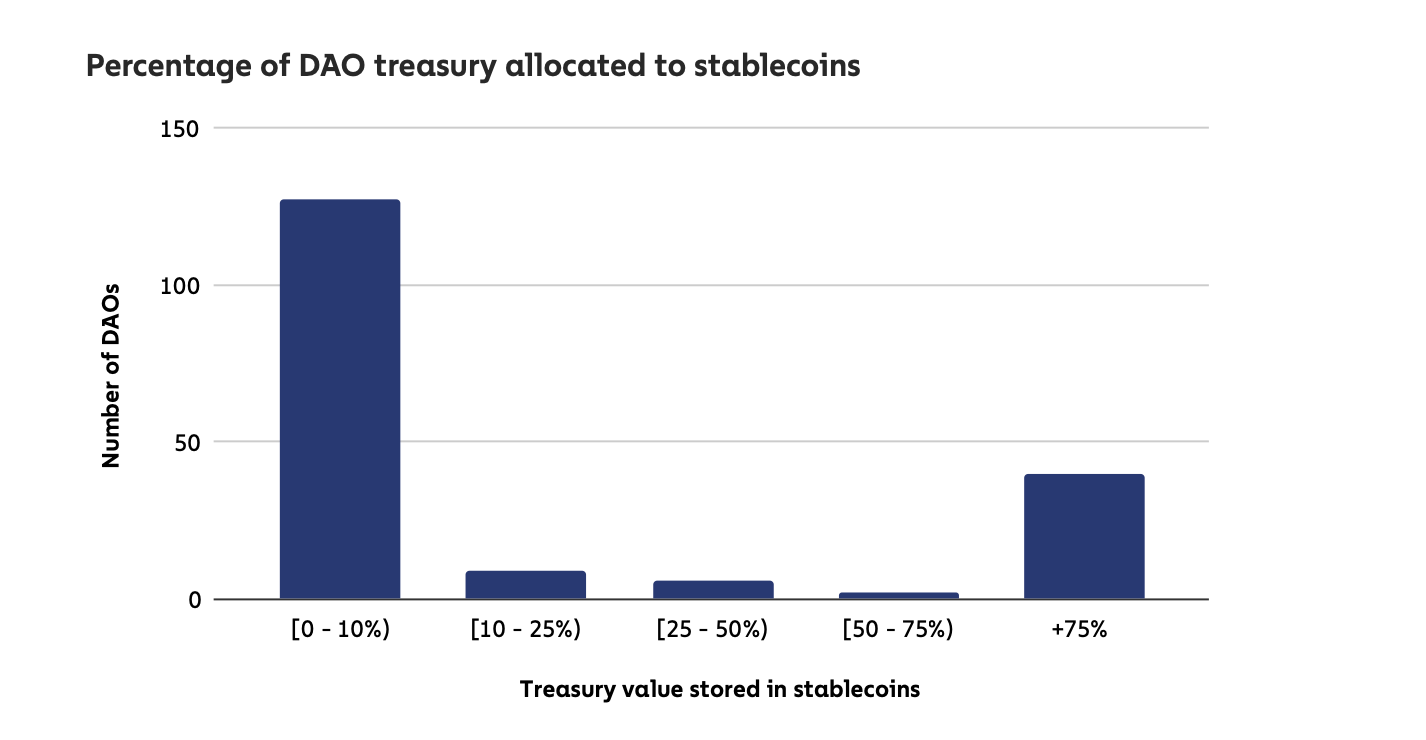
There is a caveat, though. Of the DAOs reviewed by Chainalysis, some ~85% stored their entire treasury in a single asset. I would presume this is typically the token issued by the venture. Only about 23% of the DAOs covered by chainalysis were using stablecoins. Of these, ~130 had less than 10% of their AUM in stables - while about ~40 or so had north of 75% in stables. The data is a little dirty because it only checks the count of DAOs and the percentage of capital allocated to stables. Knowing the dollar value would have shed better light.
The data set also had information on who uses DAOs. Only $1 in every $5 that goes to a DAO today comes from a centralised service. Instead, the bulk of DAO's managed money comes from other smart contracts, lending platforms or decentralised exchanges.
NFTs are the new DeFi
Think the bear markets have frozen NFTs? Well, no. Some $37 billion have already been spent on NFTs in 2022 compared to the $40 billion total paid through 2021. The data has some more interesting figures.
There are some ~750k NFT buyers and sellers active on-chain as the report was released. The peak for this figure was in Q1 this year when the figure almost hit 1 million users. That’s the total size of the NFT market so far. What I found intriguing is that the figure is up some ~20 times compared to ~Q1 2021. Not a bad year for NFTs.
Institutions do a tiny sum of transactions related to NFTs. In terms of frequency of transactions, it seems north of 90% of the transactions is with assets valued below $10k. Does this mean institutions and traders don’t matter? Well, not really. Traders handling $10k-$100k worth of assets and institutions (those making trades north of $100k) account for some 90% of the volume.
I think we will see the market bifurcate into two at this point.
Low-end, affordable NFTs will likely be predominantly done on layer twos or low-cost networks like Solana. This will focus on relatively low transaction fees and add to the user experience instead of becoming a speculatory instrument
Costly NFTs that are in par with art. Consider tokenised music rights or the likes of Bored Apes for this. They will likely be on layer ones where “old” money from early adopters already exists. They would not care about spending a few hundred dollars in fees so long as there is transaction finality.
Founders will have to pick on servicing either one of the two. For most NFTFi-related founders, focusing on the latter will likely be vital to scaling. Metastreet.xyz is an excellent example of a venture doing that. The chart below explains why
(Note: I have exposure to metastreet through LedgerPrime and personal angel cheques)
The number of NFT-linked transactions valued north of $100k is currently at a peak. As late as April 2022 - there were over 4000 transactions each month valued north of $100k. For ventures to capture a small portion of that transaction volume and slap even a 0.2% fee on top of it can be highly lucrative. The report also dives into holding behaviour for metaverse real-estate.
“In 10 out of 11 of the projects we studied, users have held their VRE NFTs for less than 25% of the time the NFT collection has been live. In 6 out of 11, they’ve held it for less than 15%. In other words, VRE purchases in most of the above projects would be best characterized as “flipping.”
It shows a trend where metaverse real estate is akin to token instruments. People buy it currently with the idea of selling it at a higher price. One of the things I’d have loved to see here is the average time to all-time-high for real estate plots in each of these worlds in several days and how long it has been since. I assume that the ATH of real-estate assets is currently within a few days of launch, and they do not retain value over time. I have access to some metaverse data sets, so we will dig into it later.
The rest of the report covers information on UST’s de-peg. I will avoid going into that for now but will wrap up with colour on the most active wash-traders I have seen. The report refers to a “platform” that rewards tokens for trade volumes. I presume this is looksrare. They had launched a token earlier in the year.
Wash trading generally refers to people trading between themselves to create an illusion of volume. In the case of crypto - a single person can spin up thousands of wallets to claim airdrops. These wash traders are impressive for how blatant they are. They did some 650,000 ETH in volume, selling and buying the same 3 NFTs between themselves.
At no point did they interact with any other seller or buyer. The wallets in question managed to spend $114 million on gas fees to receive about $185.5 million worth of tokens.
I am just baffled that the team did not bother calling off these rewards because it would have been easy to see these spam transactions on-chain. If you are one of the wash traders, please reach out to me. I would love to interview you.
TL:DR
Decentralised exchanges have managed to do over $1 trillion in volume
They also have ~55% of volume of assets going towards exchanges.
NFTs a crucial part of on-boarding retail. Average wallet interacting with NFTs has an age of 10 days compared to DeFi at 300.
NFTs are also the fastest-growing on-chain fee-paying segment. Up from ~5% a year back to 25% on Ethereum now
Decentralised exchanges have terrifying power laws. Top 5 DEXes command ~85% of the volume
Same trend in lending platforms. Aave and DeFi collectively command ~90% of capital moved through lending platforms
50% of all assets taken from lending platforms go to an exchange
The average DeFi related DAO commands ~100 million in AUM. ( 60 DAOs in total handling $6 billion)
85% of the DAOs tracked by Chainalysis have their treasury in a single asset. USDC is more preferred than DAI for DAOs handling stablecoins
Sub $10k transactions command ~90%+ of the frequency of transactions for NFTs. There were ~750k active buyers and sellers for NFTs in the past quarter.
You can download the whole report from the button below
If you enjoyed reading this, consider signing up below. Its a bear market and I will be amping up my writing. Hopefully
Also, leave a comment and let me know if you think any of my assessments of these data sets are wrong.
Off to have dinner with a founder,
Joel


Hi! a very insightful post, thank you! would you like to discuss some partnership/collab opportunities? if yes, where can I reach you out?